
Logistics
The Hidden Cost of Empty Space: How Transport Inefficiency Drains Your Supply Chain Budget
Thomas Goldhofer
·
Co-Founder
·
·
6 min

Empty space looks harmless because it has no weight and rarely appears as its own line on a freight invoice. Yet every oversized carton, unstable pallet pattern and non-stackable load consumes capacity that the business has already paid for. This article shows how to make that hidden cost visible without treating product protection as an afterthought.
Empty space is one of the few supply chain inputs that companies purchase repeatedly without intending to own it. It travels inside cartons, between cases on a pallet and above loads that cannot be stacked. No supplier issues an invoice for “air”, yet the cost appears elsewhere: In dimensional-weight charges, extra pallet positions, additional vehicle movements, packaging material, warehouse space and avoidable emissions.
That makes transport inefficiency more than a logistics problem. It is often a design and data problem whose consequences are distributed across packaging engineering, procurement, operations, sustainability and finance. The uncomfortable question is not simply whether a box could be smaller. It is whether the company can see the total economic effect of packaging decisions before those decisions become recurring flows.
Empty space is purchased capacity
Freight capacity is constrained by both mass and volume. Dense goods may reach a vehicle's weight limit first; lightweight or awkward products may “cube out”, filling the usable volume before the weight limit is reached. In parcel and air-express networks, this trade-off is explicit: carriers compare actual weight with volumetric or dimensional weight and charge on the higher figure. DHL Express, for example, explains a calculation based on package length multiplied by width and height, divided by a volumetric divisor; the exact commercial rule depends on the service and carrier.
The same economics exist when an invoice does not show dimensional weight. A partly utilized trailer still consumes a driver, tractor, route and loading slot. A poorly filled sea container still occupies one container position, while a warehouse still allocates a location to a pallet whose upper volume cannot be used.
This is why freight cost per kilogram can conceal the problem. The more revealing denominator is often cost per saleable unit, per usable cubic metre, or per complete product delivered. Air has no mass, but it has an opportunity cost.
How a small void becomes a network multiplier
Empty space rarely remains inside one carton. It multiplies through the hierarchy of the load:
An oversized primary or secondary pack reduces units per case.
The case footprint creates gaps, overhang or an inefficient pallet pattern.
Poor pallet geometry reduces stackability or leaves unusable trailer and container volume.
More logistics units create more handling, labels, scans, storage locations and transport movements.
The effect can therefore be nonlinear. Reducing a carton by a few millimetres may do nothing; crossing a dimensional threshold may add another item per layer, another layer per pallet or another pallet per vehicle. The reverse is equally true: A small design change can break a stable pallet pattern and increase total system cost.
Research from Fraunhofer IML illustrates the size of the opportunity in a specific e-commerce context. Industry partners using its carton-set optimization approach increased volume utilization by 35 to 45 percent while reducing the number of carton types. This is not a universal savings benchmark, but it shows why order structure and the available carton portfolio must be evaluated together rather than box by box.
The metric problem: one fill rate is not enough
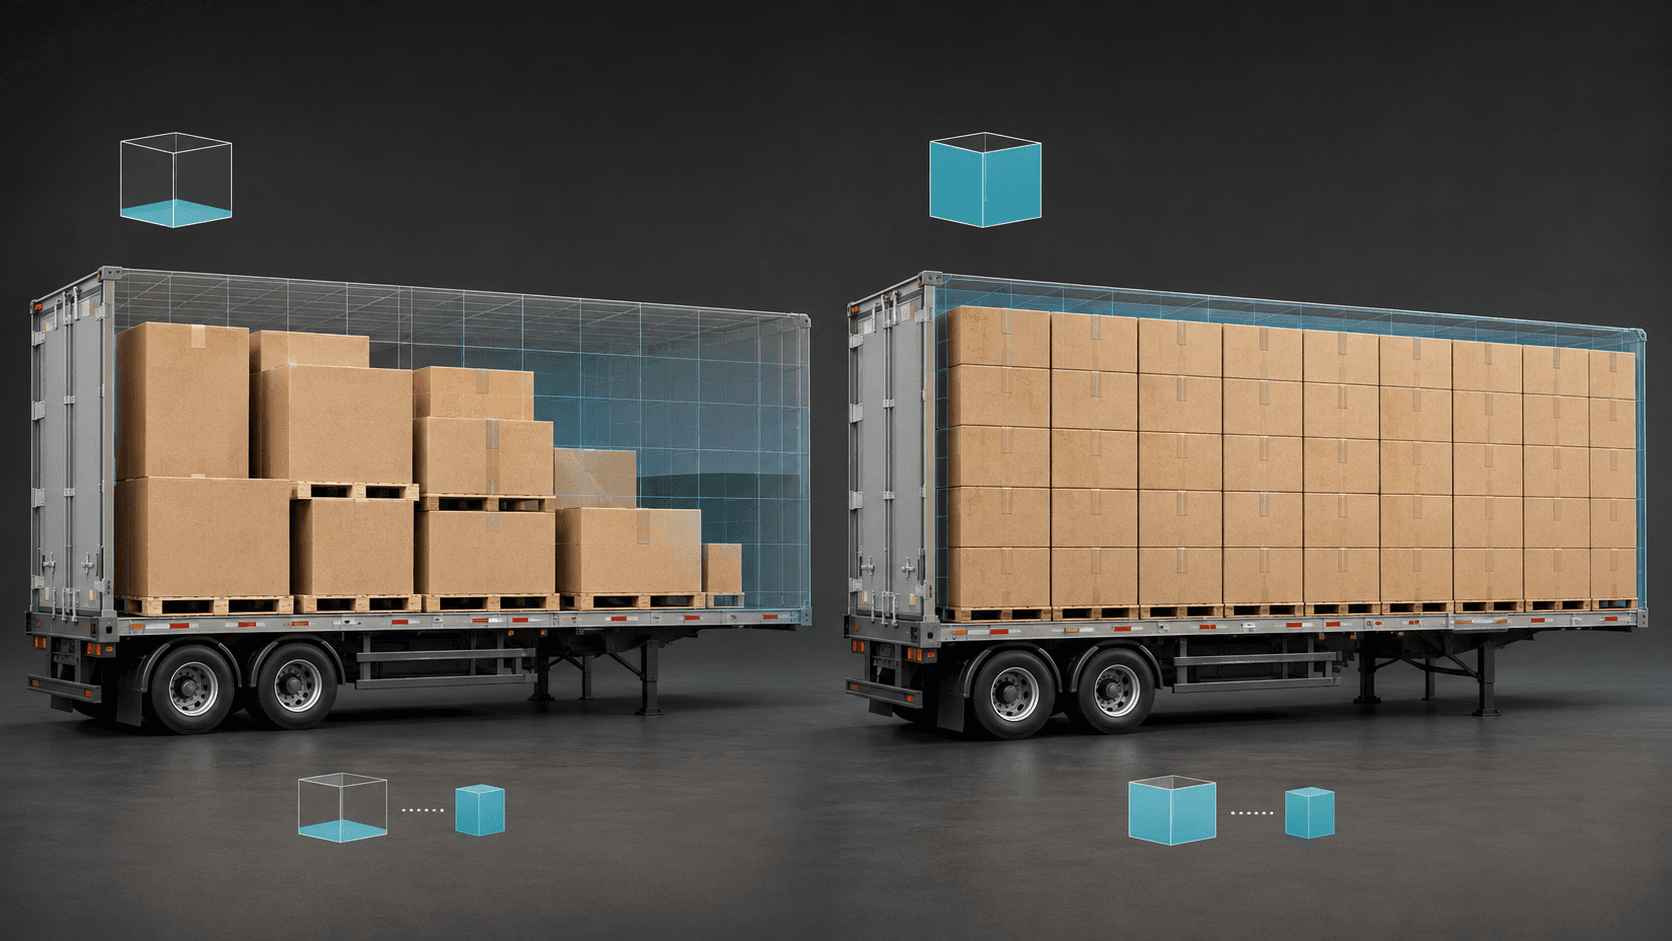
Figure 1: Cube utilization must be assessed across cartons, pallets and the usable vehicle envelope.
Companies often report one “fill rate”, although several questions are involved. Product-to-pack ratio measures occupied package volume; Pallet cube utilization examines the occupied pallet envelope. Vehicle utilization must also consider payload, stackability, axle limits and route constraints.
A credible baseline therefore needs dimensions and weight at every relevant packaging level, plus the relationships between them. GS1's Package and Product Measurement Standard provides a consistent, repeatable method for measuring packaged and unpackaged trade items and links accurate dimensional data to logistics efficiency and freight accuracy.
Data quality matters because volume is multiplicative: Errors in length, width or height compound in the calculated cube. Nominal CAD dimensions do not automatically represent a packed load because tolerances, closures, dunnage and pallet overhang change the real envelope. The useful record is the approved packing configuration, not isolated ideal dimensions.
Empty space is becoming a compliance issue
In the EU, the Packaging and Packaging Waste Regulation (PPWR), Regulation (EU) 2025/40, generally applies from 12 August 2026. It connects packaging minimization with documented performance criteria and introduces a specific empty-space obligation. By 1 January 2030, or three years after the relevant implementing acts enter into force if that is later, operators filling grouped, transport or e-commerce packaging must keep the empty-space ratio at or below 50 percent.
The final calculation methodology is due from the European Commission by 12 February 2028. Under the regulation, filling materials such as paper cuttings, air cushions and foam fillers count as empty space. The text also recognizes that sufficient space may be necessary for product protection, irregular shapes, legal requirements and labels.
That distinction matters. The PPWR is not a mandate to compress every shipment until damage increases. It is a reason to document why volume is necessary, what alternatives were assessed and how the chosen packaging performs. This article is not legal advice; companies should assess applicability and evidence requirements for their own packaging roles and product categories.
Optimize the system, not just the box
Aggressive downsizing can create false savings. If a smaller pack increases damage, line stoppages, repacking, ergonomic risk or manual handling time, the avoided freight cost may be overwhelmed by operational losses. Likewise, replacing ten carton sizes with two may simplify purchasing while increasing average void fill.
The right objective is therefore constrained optimization: Minimize total landed cost and environmental impact while meeting protection, quality, handling, stackability and compliance requirements. Those constraints should be explicit. They may include product orientation, surface sensitivity, centre of gravity, maximum gross weight, permissible stacking load, moisture protection, dangerous-goods rules and worker handling limits.
Emissions should also be treated as an outcome of actual transport activity, not as an automatic claim attached to a smaller box. ISO 14083 establishes a common methodology for quantifying and reporting greenhouse-gas emissions from transport chains, while the GLEC Framework aligns logistics emissions accounting with that standard. Better cube utilization can reduce allocated emissions when it reduces capacity demand or vehicle movements, but the result should be calculated using the relevant mode, route, load and carrier data.
A practical programme for exposing the hidden cost
1. Build a representative baseline
Use a meaningful period of order and shipment history, not a convenient week. Connect SKU dimensions, packaging materials, carton selection, pallet patterns, route, carrier tariff, damage and returns. Segment the analysis by product family and transport mode because a universal average hides the constraints that drive each flow.
2. Measure cost at every packaging level
Track product-to-pack ratio, case fill, pallet height utilization, stackability, vehicle cube and payload utilization. Translate these into packaging spend, chargeable weight, pallet positions, load metres, storage, handling and damage cost. Keep “theoretical cube” separate from usable capacity.
3. Model scenarios before changing standards
Compare alternative orientations, carton sets, returnable containers, layer patterns and load plans. CAD-based analysis and three-dimensional bin packing can reveal threshold effects before physical trials. Scenario results should show not only volume saved, but also the downstream change in logistics units and total cost.
4. Validate protection and operability
Run appropriate physical tests and controlled pilots. Confirm that packs can be assembled consistently, labels remain usable, loads are stable, workers can handle them safely and products survive the real distribution environment. A mathematically dense pack is not automatically a production-ready pack.
5. Govern the result as a decision
Assign an owner, approval status and effective date to each packing instruction. Retain inputs, assumptions, test evidence, exceptions and version history. Monitor actual dimensions, utilization, damage and freight spend after release. Packaging efficiency then becomes a controlled operating parameter rather than a one-off workshop result.
The budget question leaders should ask
European road freight data provide a wider warning about unused capacity: 21.8 percent of EU road-freight vehicle-kilometres in 2023 were travelled by empty vehicles. Empty running is not the same as empty space inside loaded packaging, but both expose the same management failure: Capacity is costly even when it carries no saleable value.
The most useful question is therefore not, “How much air is in this box?” It is, “What recurring capacity, cost and emissions does this packaging decision create across the network?” Answering that requires product geometry, packaging master data, load constraints and commercial freight logic to meet in one model.
Pakera can support this kind of analysis by connecting CAD-based packaging planning with container selection, utilization comparisons, packing instructions, approvals and documentation. The purpose is not to promise a perfect fill rate or guaranteed compliance. It is to make trade-offs visible early enough for packaging, logistics and procurement teams to choose deliberately.
Empty space will never disappear completely, nor should it. Some space protects the product and keeps operations safe. The avoidable portion, however, is a budget decision. Once it is measured across the whole load hierarchy, air stops being invisible and starts becoming manageable.
See how Pakera can help to reduce empty space
Digital Pallet & Container Optimization
Sources:
Weight and Dimensions. DHL Express Product Team, 21 November 2023. https://www.dhl.com/discover/en-gb/ship-with-dhl/products-and-services/weight-and-dimensions.
Optimal Shipping Carton Utilization. Fraunhofer-Gesellschaft / Fraunhofer IML, 1 March 2024. https://www.fraunhofer.de/en/press/research-news/2024/march-2024/optimal-shipping-carton-utilization.html.
GS1 Package and Product Measurement Standard, Release 3.2. GS1 AISBL, March 2024. https://www.gs1.org/docs/gdsn/3.1/GS1_Package_Measurement_Rules.pdf.
Packaging Waste. European Commission, Directorate-General for Environment, updated 2026. https://environment.ec.europa.eu/topics/waste-and-recycling/packaging-waste_en.
Regulation (EU) 2025/40 of the European Parliament and of the Council of 19 December 2024 on Packaging and Packaging Waste. European Parliament and Council of the European Union, Official Journal of the European Union, 22 January 2025. https://eur-lex.europa.eu/eli/reg/2025/40/oj.
ISO 14083:2023 — Greenhouse Gases: Quantification and Reporting of Greenhouse Gas Emissions Arising from Transport Chain Operations. International Organization for Standardization, March 2023. https://www.iso.org/standard/78864.html.
GLEC Framework for Logistics Emissions Accounting and Reporting, Version 3.2. Smart Freight Centre / Global Logistics Emissions Council, October 2025. https://community.smartfreightcentre.org/news/13311209.
Road Freight Transport by Journey Characteristics. Eurostat, data for 2023, published 2024. https://ec.europa.eu/eurostat/statistics-explained/SEPDF/cache/11732.pdf.